The Construction-View Overlay: Projections and the In-Page Tool
The recording chapter made GET /dev/__trace/:id return a page’s whole construction as JSON: every frame, every Datomic read. That answers how was this page built? in the large. This chapter does two things. First it defines the targeted projections over that same recording: flow mode, which takes one rendered element and traces its value back to the query behind it, and the dossier, a set of drill-downs for a single frame (navigate a recorded value, ask “why is this section empty?”, find the read that produced an entity, see the markup a component became, thread a value through every frame it touched). Then it builds the in-page tool that renders all of it: src/myapp/web/trace-overlay.js. All of it is data you can curl, and we build the overlay the way you’d actually grow it: get the call tree on screen first, then make a selected frame open a rich details pane, then add an icicle (flame-graph) overview, and finally layer on the projections (flow mode, the dossier), cross-region traces, and the polish. Each step is usable before the next exists.
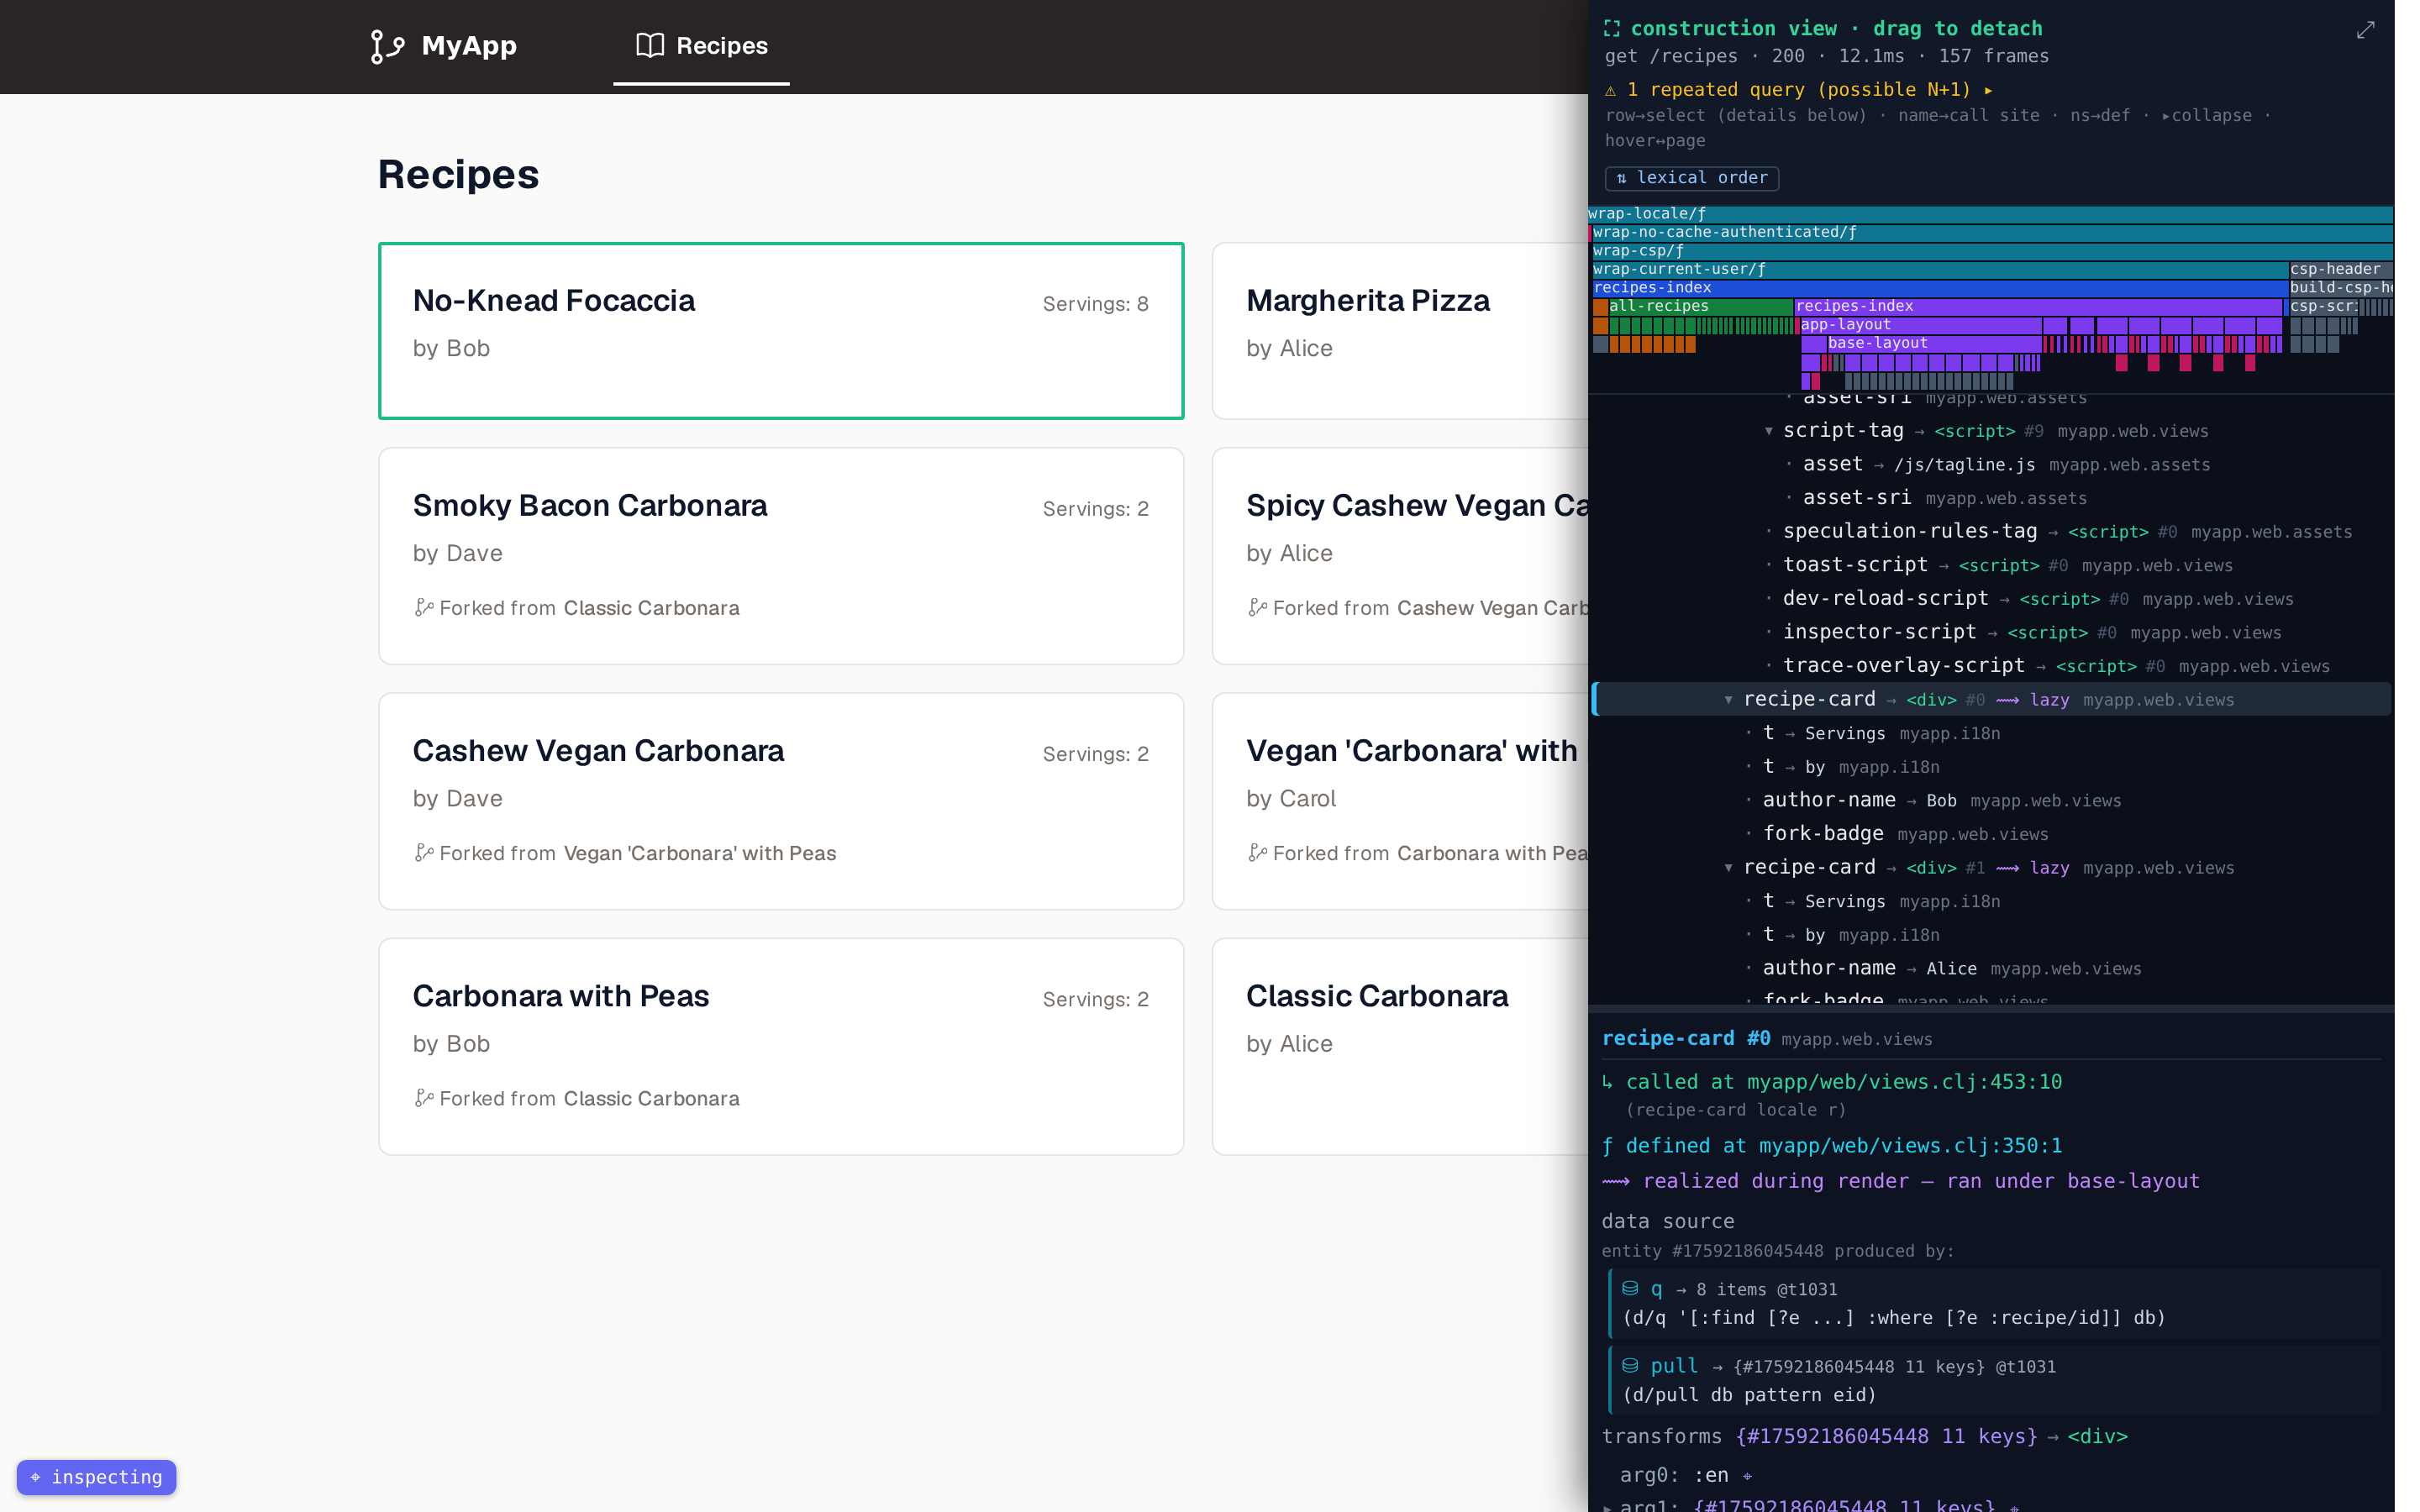
Selecting a frame fills the dossier: call site, the eid-matched reads that produced its data, the queries behind them, and the value transforms – the drill-downs this chapter builds over the recording.
Before the code, here is the finished tool end to end, so the pieces below have something to attach to. You load the recipe index under the :storm alias and press Alt+Shift+I. A panel docks to the right with the call tree for the request that built the page: middleware narrowing to the handler recipes-index, which fetches with all-recipes and renders the eight recipe-card frames. Hover a frame and its instance lights up on the page; click it and a details pane fills with that call’s arguments and Hiccup return (navigable level by level), the pull and d/q that fed it as full Datalog, a db→map→hiccup transforms badge, and the conditionals in its body that rendered nothing. Alt+click a card on the page and a flow card pins that specific instance: its ancestor path, the reads whose results contained its entity, and finally a d/history pivot for the write behind it. An always-on icicle strip above the tree maps the request’s shape at a glance, and a header toggle flips the tree between lexical and temporal parenting. The rest of the chapter assembles that tool in the order you’d build it.
What this investment buys, and when. This is the third chapter (16, 17, 18) on a single dev tool, and the cumulative machinery is substantial: a compiler swap, a recording middleware, seven
/dev/__*projections, a roughly 900-line overlay. So it is worth being clear about what it is for. The everyday “why is this value wrong?” still has its cheap answer, aprintlnand a REPL, and that is often enough. What the construction view adds is the question those are bad at: which of N identical components on the page in front of you rendered the wrong thing, fed by which query, read at which basis-t. You answer it by clicking the pixel. That is the inspector’s REPL-to-the-browser thesis (chapter 16) carried one step further: from where is this element from? to everything the server did to build it. The reusable idea travels even if you never build this exact tool; the tool itself pays off the day you hunt a wrong value across identical components.The listings below are abridged to the parts that carry the idea;
,,,marks elided plumbing. The complete, runnable file issrc/myapp/web/trace-overlay.jsin the companion repo; this chapter is a guided tour of it, not a transcription, so read the two together when a skeleton leaves you wanting the body.
The overlay ships in the same dev-only defn-asset block as the inspector, next to dev-reload and inspector:
;; myapp.web.views — the dev asset block (absent in prod)
(when (try (requiring-resolve 'dev-reload/websocket-handler) (catch Exception _ nil))
  (list (dev-reload-script) (inspector-script) (trace-overlay-script)))
Bootstrap, and riding the inspector’s toggle
The very first thing the script does is read the welded trace id and bail if it isn’t there, so under plain :dev (no :storm) the script may load but does nothing:
(function () {
  "use strict";
  var traceId = document.documentElement.getAttribute("data-myapp-trace-id");
  if (!traceId) return;     // not under ClojureStorm — inert
  ,,,
})();
The overlay has no button of its own. It opens on the inspector’s myapp:inspect event, so Alt+Shift+I (or the corner badge) brings up both at once: the inspector answering where is this element from? and the construction view answering how was this whole page built?:
function inspectEnabled() { try { return localStorage.getItem("myapp-inspector") === "1"; } catch (e) { return false; } }
document.addEventListener("myapp:inspect", function (e) { setOpen(!!(e.detail && e.detail.enabled)); });
One cooperation detail makes the two coexist: the panel marks itself data-myapp-overlay, and the inspector treats any click inside such an element as “ours”, so inspect-mode’s capturing click handler never swallows a click on the trace panel.
On load it fetches the trace for this page (and, for later, asks whether a prior request errored):
function start() {
  connectWs();
  fetch("/dev/__trace/" + encodeURIComponent(traceId), { headers: { Accept: "application/json" } })
    .then(function (resp) { if (!resp.ok) { console.error("[construction-view] trace fetch failed:", resp.status); return null; } return resp.json(); })
    .then(function (j) {
      if (j && j.spans) { trace = j; traces[traceId] = j; if (wantOpen || inspectEnabled()) setOpen(true); }
      ,,,
    })
    .catch(function (e) { console.error("[construction-view]", e); });
  ,,,
}
if (document.readyState === "loading") document.addEventListener("DOMContentLoaded", start); else start();
The highlight: one selector that joins tree to page
Everything visual rests on one selector. Given a component name and an instance index, box the k-th rendered element with that data-myapp-name:
function highlight(name, instance) {
  var nodes = name ? [].slice.call(document.querySelectorAll('[data-myapp-name="' + cssEsc(name) + '"]')) : [];
  if (instance != null && nodes[instance]) nodes = [nodes[instance]];   // the SPECIFIC instance
  var t = null, l = null, r = null, b = null;
  nodes.forEach(function (nd) {
    var k = nd.getBoundingClientRect();
    if (k.width === 0 && k.height === 0) return;
    t = t === null ? k.top : Math.min(t, k.top); l = l === null ? k.left : Math.min(l, k.left);
    r = r === null ? k.right : Math.max(r, k.right); b = b === null ? k.bottom : Math.max(b, k.bottom);
  });
  if (t === null) { hlKey = null; box().style.display = "none"; return null; }
  hlKey = { name: name, instance: instance };
  var bx = box();
  bx.style.display = "block"; bx.style.top = t + "px"; bx.style.left = l + "px";
  bx.style.width = (r - l) + "px"; bx.style.height = (b - t) + "px";
  return nodes[0];
}
That selector, [data-myapp-name="…"], is the byte-identical string the server keyed the span on. No index, no fuzzy matching: the inspector stamped it, the recording recorded it, and the overlay selects on it. This one function is the entire bridge between the JSON tree and the live page.
Step one: render the trace tree
The minimal useful overlay is the call tree, on screen, correlating with the page on hover. We start there.
A ValueRef renders as a short string with a preattentive color per kind. The data-viz principle is that type is categorical, so it gets a hue, not a shape:
function vref(v) {
  if (!v) return "";
  switch (v.kind) {
    case "nil": return "nil";
    case "db": return "db@t" + (v["basis-t"] != null ? v["basis-t"] : "?");
    case "scalar": return v.preview;
    case "hiccup": return "<" + v.tag + ">";          // a rendered element
    case "map": return "{" + (v.eid != null ? "#" + v.eid + " " : "") + v.n + " keys}";
    case "coll": return v.n + " items";
    case "seq": return "(lazy)";
    default: return v.preview || v.type || "?";
  }
}
var VCOLOR = { map: "#a78bfa", coll: "#60a5fa", set: "#22d3ee", seq: "#64748b",
               hiccup: "#34d399", db: "#fbbf24", scalar: "#cbd5e1", nil: "#475569", opaque: "#94a3b8" };
function vglyph(v) {
  var s = el("span", "color:" + (VCOLOR[v && v.kind] || "#cbd5e1") + ";white-space:nowrap;", vref(v));
  if (v && v.eid != null) s.title = "entity #" + v.eid;
  return s;
}
The tree is a recursive renderNode. Each row shows the function (named by its call site, the logical flow, with the definition on the ns label beside it), its return glyph, its instance index, and any lazy/N+1/threw badges; db-ops render as child rows. The two interactions that matter at this stage: hovering a row previews the element on the page through the inspector’s highlight (so it looks identical to a selection later), and clicking opens the source in the editor:
function childrenOf(s) { return (temporal ? s["children-rt"] : s.children) || []; }
function rootsOf() { return (temporal ? trace["roots-rt"] : trace.roots) || []; }

function renderNode(id, depth) {
  var s = trace.spans[id]; if (!s) return null;
  var wrap = el("div");
  var kids = childrenOf(s);
  var row = el("div", "padding:1px 6px 1px " + (6 + depth * 12) + "px;white-space:nowrap;overflow:hidden;text-overflow:ellipsis;border-radius:3px;");
  // disclosure triangle, name → call site, ret glyph, instance #, lazy/repeat/threw badges, ns → defn
  ,,,
  // hover previews the element via the INSPECTOR's highlight (matches selection); see myapp:peek
  row.addEventListener("mouseenter", function () { row.style.background = "#1f2937";
    document.dispatchEvent(new CustomEvent("myapp:peek", { detail: { name: s.name, idx: s.instance == null ? 0 : s.instance } })); });
  row.addEventListener("mouseleave", function () { row.style.background = "";
    document.dispatchEvent(new CustomEvent("myapp:peek", { detail: {} })); });
  // click selects → details pane + inspector highlight + editor cursor (selection comes in step two)
  row.addEventListener("click", function (e) { e.stopPropagation(); openSrc(s["call-src"] || s.src); setSelected(s.id, true); });
  wrap.appendChild(row);
  rowById[id] = row;
  (s["db-ops"] || []).forEach(function (op) { wrap.appendChild(dbopRow(op, depth + 1)); });
  var childWrap = el("div"); childWrapById[id] = childWrap;
  kids.forEach(function (c) { parentById[c] = id; var cn = renderNode(c, depth + 1); if (cn) childWrap.appendChild(cn); });
  wrap.appendChild(childWrap);
  return wrap;
}
childrenOf/rootsOf read a temporal flag, so a single header button flips the whole tree between lexical order (nested where the code is written, with lazy frames re-parented to their owner) and temporal order (where it actually ran). The server emitted both parentings in build-spans so this toggle costs nothing but a re-render.
The reverse direction, hovering a page element to reveal its tree row, uses compInfo to map an element to its component name and DOM index, then scrolls the matching row into view:
function compInfo(targetEl) {
  var comp = targetEl.closest('[data-myapp-name^="myapp"]');
  if (!comp) return null;
  var name = comp.getAttribute("data-myapp-name");
  var idx = [].slice.call(document.querySelectorAll('[data-myapp-name="' + cssEsc(name) + '"]')).indexOf(comp);
  return { comp: comp, name: name, idx: idx };
}
function onPageHover(e) {
  if (!open || !trace) return;
  if (panel && panel.contains(e.target)) { ,,, return; }   // over the panel → restore selection
  var ci = compInfo(e.target);
  if (!ci) return;
  highlight(ci.name, ci.idx);
  if (regionTraceId(e.target) === traceId) { var id = findSpan(ci.name, ci.idx); if (id) pageReveal(id); }  // reveal only within the active region's trace
}
document.addEventListener("mouseover", onPageHover, true);
Clicking a row opens source through the same /dev/ws relay the inspector built – no new transport, no new trust boundary:
function openSrc(src) {
  if (!src) { toast("no source location"); return; }
  var loc = parseSrc(src);                              // "file:line:col" → {file, line, col}
  if (ws && ws.readyState === 1) { ws.send(JSON.stringify({ type: "open", src: loc.file, line: loc.line, col: loc.col })); toast("opening " + loc.file + ":" + loc.line); }
  else toast("dev socket not connected");
}
At this point the overlay is already useful: open the inspector, the panel shows the call tree, hovering a row boxes the element it produced (and hovering the page reveals its row), and clicking opens the source. The tree reads like the page being built:
wrap-locale › … › recipe-show
  recipe-by-id        ⛁ (d/entid …) → 17592186045442   ⛁ pull* (d/pull …) → {n=10} @t1031
  forks               ⛁ (d/q '[:find [?c ...] …]) → [] @t1031
  version-history     ⛁ (d/history db) → db   ⛁ (d/as-of db tx) → db   ⛁ (d/pull …) @t1031
  recipe-detail
    author-name → "Bob"   text-block → 3   app-layout › base-layout › …
(This is the detail page – the recipe-show handler for a single recipe; the index page, built from eight recipe-card frames, is the running example elsewhere in the chapter.)
Step two: the details pane
Now make a click do more than open source: select the frame and show its dossier. A persistent pane at the bottom re-renders on every selection change. fillDetails lays it out in order of usefulness when something is wrong:
- a throw box first, if the frame threw;
- where it was called and defined (both open in the editor);
- a lazy note linking to where it actually ran;
- the data source: the eid-matched reads from
/dev/__source; - the transforms morph badge;
- the queries it ran, with full Datalog;
- navigable args/ret;
- the not-rendered conditionals, from
/dev/__branches; - the produced markup, from
/dev/__hiccup.
Each /dev/__* route these read is defined in The server-side projections below; here we meet them as the overlay consumes them. A representative slice: the call/def links and the lazy /dev/__source fetch:
function fillDetails(d, s) {
  if (s.threw) { ,,, }                          // red throw box first
  if (s["call-src"]) d.appendChild(srcLink("↳", "called at", s["call-src"], "#34d399"));
  if (s.src) d.appendChild(srcLink("ƒ", "defined at", s.src, "#22d3ee"));
  ,,,
  // the entity this frame RECEIVED — which DB read produced it (lazy)
  if ((s.args || []).some(function (a) { return a && a.eid != null; })) {
    var dsH = el("div", "color:#6b7280;margin-top:2px;", "…"); ,,,
    fetch("/dev/__source/" + encodeURIComponent(traceId) + "?frame=" + s.id, { headers: { Accept: "application/json" } })
      .then(function (r) { return r.ok ? r.json() : null; })
      .then(function (j) {
        if (selectedId !== s.id) return;          // selection moved while fetching — drop
        ,,,                                       // render "entity #N produced by: ⛁ …"
      });
  }
  if (s.morph) { ,,, }                            // transforms badge
  (s["db-ops"] || []).forEach(function (op) { ,,, });   // the queries this frame ran
  (s.args || []).forEach(function (a, i) { d.appendChild(valueNode(s.id, "arg" + i, [], a, "arg" + i, 0)); });
  if (s.ret && s.ret.kind !== "nil") d.appendChild(valueNode(s.id, "ret", [], s.ret, "ret", 0));
  ,,,                                             // not-rendered + produced-markup sections
}
Each arg and the return is a valueNode: a glyph, a ▸ that lazy-expands one level through /dev/__value, and a ⌖ that threads the value through every frame it touches (via /dev/__value-threads):
function valueNode(frame, slot, path, vr, keyLabel, depth) {
  var wrap = el("div"), row = el("div", ,,,);
  var expandable = vr && ["map", "coll", "set", "seq", "hiccup"].indexOf(vr.kind) >= 0 && (vr.n == null || vr.n > 0);
  var tri = el("span", ,,, expandable ? "▸" : " ");
  row.appendChild(tri);
  if (keyLabel != null) row.appendChild(el("span", "color:#94a3b8;", keyLabel + ": "));
  row.appendChild(vglyph(vr));
  if (!path.length) {   // ⌖ thread: highlight every frame this value flows through
    var th = el("span", ,,, "⌖");
    th.addEventListener("click", function (e) { e.stopPropagation(); threadValue(frame, slot); }); row.appendChild(th);
  }
  wrap.appendChild(row);
  var kids = el("div"); kids.style.display = "none"; wrap.appendChild(kids);
  if (expandable) tri.addEventListener("click", function () {
    if (kids.style.display === "none") { kids.style.display = "block"; tri.textContent = "▾"; fetchExpand(frame, slot, path, kids, depth); }
    else { kids.style.display = "none"; tri.textContent = "▸"; }
  });
  return wrap;
}
Selecting a frame anywhere (a tree row, a clicked page element, a markup node) should light it up everywhere: the bottom pane, the inspector’s box on the page, and the editor cursor. A shared myapp:select event carries the selection, and each side guards its own echo so the broadcast can’t loop. setSelected is the hub:
function setSelected(id, broadcast, el) {
  // a user selection is about to openSrc; the editor's reverse-highlight for that
  // location echoes back (resolving to the CALL SITE's component, e.g. the parent) —
  // guard a short window so the echo can't steal the selection we just made.
  if (broadcast) selGuardUntil = Date.now() + 800;
  markSelected(id, el && el.path);
  if (broadcast) {
    var s = (id != null && trace) ? trace.spans[id] : null;
    selBroadcasting = true;
    try { document.dispatchEvent(new CustomEvent("myapp:select",
      { detail: s ? { name: s.name, idx: s.instance == null ? 0 : s.instance, node: el && el.node } : { name: null } })); } catch (e) {}
    selBroadcasting = false;
  }
}

document.addEventListener("myapp:select", function (e) {
  if (selBroadcasting || !trace) return;            // ignore our own echo
  if (Date.now() < selGuardUntil) return;           // ignore the openSrc reverse-highlight echo
  var d = e.detail || {};
  if (!d.name) { markSelected(null); return; }
  ,,,
  var id = findSpan(d.name, d.idx == null ? 0 : d.idx);
  ,,,                                               // fall back to any instance of the name
  markSelected(id);
});
Lesson – guard the echo, don’t suppress the source. The subtle bug here: clicking a row calls
openSrc, which moves the editor cursor, which makes the editor bridge send a reverse-highlight back. That highlight resolves to the call site’s component (often the parent), clobbering the selection you just made. The fix is a short time-based guard (selGuardUntil) on both the trace and the inspector: drop any incoming reverse-highlight for 800ms after a user selection. Direct user clicks bypass it (they don’t arrive through the listener), so only the unwanted echo is suppressed. An earlier component-matched guard was too narrow: it missed the cross-component parent case.
The inspector side mirrors this exactly: it listens for myapp:select (boxing the one selected instance, with the same 800ms echo guard) and myapp:peek (drawing the same reverse-highlight on hover, restored on leave), and it broadcasts myapp:select on its own editor-driven reverse-highlight. Three surfaces, one event, no loop.
Step three: the icicle overview
A tall tree is hard to read at a glance, so the panel header gets an icicle (a flame-graph cousin). One cell per frame, partitioned top-down, width ∝ subtree size and color ∝ architecture layer. You read the request shape in one look: the middleware stack narrowing into the handler, a narrow db column beside the wide views subtree. It is an overview on top of the working tree, which is why we add it third, not first.
function nsColor(ns) {
  ns = ns || "";
  if (ns.indexOf("web.routes") >= 0) return "#0e7490";   // middleware (teal)
  if (ns.indexOf("web.handler") >= 0) return "#1d4ed8";  // handler (blue)
  if (ns.indexOf("db.core") >= 0) return "#b45309";      // db (amber)
  if (ns.indexOf("recipe.core") >= 0 || ns.indexOf("auth.core") >= 0 || ns.indexOf("admin.core") >= 0) return "#15803d"; // domain (green)
  if (ns.indexOf("views") >= 0) return "#7c3aed";        // views (purple)
  ,,,
  return "#334155";
}
function subtreeSize(id, cache) {
  if (cache[id] != null) return cache[id];
  var s = trace.spans[id], n = 1;
  if (s) childrenOf(s).forEach(function (c) { n += subtreeSize(c, cache); });
  return (cache[id] = n);
}
buildIcicle lays the cells out by recursively partitioning each frame’s horizontal span among its children in proportion to subtree size. Hovering a cell peeks the element on the page, and clicking opens the source and selects the frame just as a tree row does, so the overview and the detail stay in lockstep.
A cell click also applies degree-of-interest focus+context: the clicked frame’s subtree and its ancestor path stay lit while the other overview cells dim, and a click on the icicle’s empty background clears the focus. Value-threading (the ⌖ from step two) goes through the same applyDOI, its set being the frames the value flowed through plus their ancestor paths. The rule is deliberately asymmetric: an icicle click dims only the overview cells, so the tree stays fully readable, while value-threading isolates a flow and therefore gently dims the tree rows too. The page-hovered row is never dimmed, which keeps the inspect-sync visible:
cell.addEventListener("click", function (e) {
  e.stopPropagation(); openSrc(s["call-src"] || s.src); setSelected(id, true);
  // Icicle focus: light the clicked frame's subtree + ancestor path and dim
  // the other overview cells. dimRows stays false — the tree keeps full
  // contrast; only value-threading (which isolates a flow) dims rows too.
  var set = {};
  (function sub(x) { set[x] = true; var sp = trace.spans[x]; if (sp) childrenOf(sp).forEach(sub); })(id);
  for (var p = parentById[id]; p != null; p = parentById[p]) set[p] = true;
  applyDOI(set, false);
});

function applyDOI(set, dimRows) {
  Object.keys(trace.spans).forEach(function (id) {
    var on = !set || set[id];
    var row = rowById[id]; if (row && id !== pageHoverId) row.style.opacity = (dimRows && !on) ? "0.5" : "1";
    var cell = icicleCellById[id]; if (cell) cell.style.opacity = on ? "1" : "0.35";
  });
}
The server-side projections the overlay consumes
The overlay so far renders the whole-page tree the recording chapter served. The richer interactions (the details pane’s source/branches/markup sections, and flow mode next) read a family of small projections over the same recording. Each is a pure function over the window read-window already holds, behind its own dev-gated /dev/__* route, and every one shares a single envelope: resolve the descriptor, read the window, build something, serialize (catching throwables into an {:error …} map). We keep building the trace namespace from chapter 17 to add them.
Flow is the one that carries a distinct idea, so it gets shown in full below. The dossier projections are variations on the same template, distinguished only by what they build:
- value (
/dev/__value): navigate a recorded value one bounded level at a time, by a path of child indices, so the overlay can drillarg0 → 2 → 1without ever shipping the blob or forcing more than 50 children of a level. - branches (
/dev/__branches): the guard conditionals in a frame whose recorded result was nil, i.e. the bodies that didn’t render – the single-armwhenfamily (when/when-not/when-let/when-some) plus the negative and bindingifforms (if-not/if-let/if-some). Bareif/condare left out: a nil under a symmetric two-arm branch says nothing about which arm ran. The bindingifforms carry a milder version of that same ambiguity – their then-arm can legitimately return nil too – so this projection can occasionally flag a body as unrendered when its then-arm actually ran and produced nil; a known edge we accept for the far more common single-armwhencase. On an anonymous request it immediately names the auth-gatedwhens in the top nav: the SSR equivalent of “the button isn’t there because you’re logged out.” - source (
/dev/__source): the details-pane twin of flow’s eid-match. It reads the eid off a frame’s first argument and returns the recorded DB reads whose result contained it. - hiccup (
/dev/__hiccup): a component’s recorded Hiccup return, re-derived into the element tree it becomes (inlining(for …)seqs, dropping nil children, keeping thedata-myapp-*breadcrumbs). - value-threads (
/dev/__value-threads): every frame a value flows through, by object identity or by:db/id, so you can pick a value and light up its whole path. - last-error (
/dev/__last-error): the descriptor of the most recent request that 500’d, if its recording still exists, so a successful page can surface a prior error.
One representative dossier projection, value navigation, shows the shape they all share: slot-value fetches a frame’s argN or ret, expand-value enumerates one bounded level (rendering a homogeneous coll-of-maps as a table, the REBL/Portal idiom), and the path navigates child indices deterministically:
(defn- slot-value [{:keys [calls at]} frame slot]
  (when-let [m (calls frame)]
    (cond
      (= slot "ret") (some-> (:ret-idx m) at :result)
      (str/starts-with? (str slot) "arg")
      (when-let [n (parse-long (subs (str slot) 3))] (nth (vec (:fn-args m)) n nil)))))

(defn- nav-path [v path] (reduce child-at v (or path [])))   ; child-at picks the i-th child in expand order

(defn get-value-json [id frame slot path]
  (when-let [d (get-desc id)]
    (try (let [w (read-window (:tid d) (:start d) (:end d))]
           (json/write-value-as-string (expand-value (nav-path (slot-value w frame slot) path))))
         (catch Throwable e (json/write-value-as-string {:error (str (.getMessage e))})))))
Every projection above is reached through a route that shares one shape: resolve the handler via requiring-resolve (nil → 404 in prod), parse the query params, call the matching trace/get-*-json. The consolidated route list:
["/dev/__flow/:id"          ,,, ]  ; ?name=&idx=&src=file:line:col  → get-flow-json
["/dev/__value/:id"         ,,, ]  ; ?frame=&slot=arg0|ret&path=0,2,1 → get-value-json
["/dev/__branches/:id"      ,,, ]  ; ?frame=                        → get-branches-json
["/dev/__source/:id"        ,,, ]  ; ?frame=                        → get-source-json
["/dev/__hiccup/:id"        ,,, ]  ; ?frame=&slot=ret               → get-hiccup-json
["/dev/__value-threads/:id" ,,, ]  ; ?frame=&slot=                  → get-threads-json
["/dev/__last-error"        ,,, ]  ; (no params)                    → get-last-error-json
["/dev/__trace-clear"       ,,, ]  ; (no params)                    → clear-recordings!
Deliberately not built – timing/profiling. Under a recording compiler, per-frame wall-clock would mostly measure the recorder itself (its overhead dominates), so the
mswe show is the request total fromrecord-page, not per-frame timing. For real profiling, reach for a sampling profiler. The construction view answers structure and data, not time.
Trade-off – the endpoints are unauthenticated, and return real recorded values. Anything that can reach
/dev/__flowor/dev/__valuegets the actual recording: argument and result previews that can include user emails and recipe content. That is the same posture as/dev/wsfrom the inspector chapter – and mind the reach: the dev profile binds0.0.0.0, so on a shared network this surface is open to the whole LAN, not just loopback. Keep the dev server off untrusted networks, or bind it to127.0.0.1. It is prod-absent regardless, through the samerequiring-resolvegate.
Flow: from one element to the query behind it
Flow mode is the projection worth dwelling on, because it does what the inspector never could. Here is the whole idea as a single moment at the keyboard. The recipe index is on screen: eight cards, and the third shows a title you think is wrong. You Alt+click that card. The overlay sends its data-myapp-name (recipe-card) and its DOM rank (2, zero-based) to /dev/__flow, and flow does four things at once: it resolves the click to that card’s frame (the third element-producing recipe-card call in the recording, not all eight), walks its ancestor path up to the handler, reads the entity id off the card’s argument, and scans every recorded Datomic read for the one whose result contained that id. The card that comes back names the suspects: this card descends from recipes-index under the page handler, and its data came from all-recipes’ d/q and one pull – green, self-consistent, and, in the stale-title case, unhelpful, because nothing in this request set the title. So flow does the honest thing and hands you the entity id with a pivot to d/history.
Two capabilities make this more than the inspector could do, and both live in flow.
Per-instance resolution. Eight recipe cards share one data-myapp-name; the inspector, keyed on source location, can only highlight all of them. But the timeline has order: the k-th card in the DOM is the k-th element-producing recipe-card frame in the recording: the per-instance rank (the :instance flag) build-spans computed in chapter 17. So clicking the third card resolves to that instance’s frame.
Eid-matched source. A recipe card renders data some sibling call fetched earlier: all-recipes’ d/q and the per-recipe pull, not anything in the card’s own subtree. Which read produced this card? We have the card’s entity id (from its argument map) and every db-op’s recorded result, so we ask Datomic identity directly:
(defn- result-has-eid? [result eid]
  (try
    (let [hit? (fn [x] (or (= x eid) (and (map? x) (= eid (safe-eid x))) (and (sequential? x) (some #(= % eid) x))))]
      (cond (nil? eid) false
            (map? result) (= eid (safe-eid result))
            (set? result) (or (contains? result eid) (some hit? result))   ; relation [:find ?e …]
            (sequential? result) (boolean (some hit? result))               ; collection [:find [?e …]]
            :else false))
    (catch Throwable _ false)))
flow ties them together: resolve the instance, walk its ancestor path, flag the reads that produced its entity, and read the clicked line’s recorded value if a source line was passed. It reuses read-window, folded?, collect-db-exprs, and ->db-op from chapter 17:
(defn flow [{:keys [tid start end]} comp-name idx src-line]
  (let [{:keys [calls exprs-by-call at] :as w} (read-window tid start end)
        named (->> (keys calls) sort
                   (filter #(= comp-name (frame-name (calls %))))
                   ;; element-producing AND not a folded self-delegation — so the
                   ;; instance count matches the DOM node count (see build-spans).
                   (filterv (fn [i] (and (not (folded? calls i))
                                         (inspector/element? (some-> (:ret-idx (calls i)) at :result))))))
        target (when (< (or idx 0) (count named)) (nth named idx))]
    (cond
      target
      (let [m (calls target)
            eid (arg-eid (:fn-args m))
            reads (mapv (fn [d] (assoc (->db-op calls d) :source (result-has-eid? (:result (:e d)) eid)))
                    (collect-db-exprs w))
            path (loop [k target acc []]
                   (if-let [mk (calls k)]
                     (recur (:parent-idx mk)
                       (if (noise? mk) acc (conj acc {:short (short-name (frame-name mk)) :name (frame-name mk)})))
                     (vec (reverse acc))))
            ;; when src-line was passed, the recorded result of that clicked line
            ;; (scan this frame's exprs for the form whose :line matches src-line):
            value ,,,]
        {:component comp-name
         :instance (.indexOf ^java.util.List named target)
         :instances (count named)
         :span ,,,                     ; this frame's own name/args/ret preview
         :path path :reads reads :value value
         :pivot (when eid {:eid eid})})

      (seq named) {:component comp-name :instances (count named) :ambiguous true}
      :else nil)))
When an index can’t be resolved (genuine render reordering, where a sort or reverse sits between data order and DOM order), flow returns :ambiguous true rather than guessing. (A component that rendered nothing no longer causes this: per-instance counting skips non-element frames, as the limitations section spells out.)
The :pivot is where flow admits its limit. The trace explains how this request rendered the value; it does not explain why the entity holds it. In the stale-title case the cause was a write in a different request entirely: fork! copied the title onto the new entity days ago, and to Datomic the fork’s current title is perfectly correct. So flow mode does not pretend to be a root-cause oracle. It narrows the suspects, shows the data path, and pivots to the write history: it hands you the entity id and points at d/history, which is where that question actually lives.
Flow in the overlay: Alt+click an element
With the tree, details, overview, and the projections in place, flow mode is a small addition on the client: an Alt+click fetches /dev/__flow for the clicked instance and shows a card next to the cursor. onAltClick branches; a plain click selects the element (step two), an Alt+click fires flow:
function onAltClick(e) {
  if (!trace || !inspectEnabled()) return;
  var ci = compInfo(e.target);
  if (!ci) return;
  if (!e.altKey) { ,,, return; }                    // plain click → element-level selection
  e.preventDefault(); e.stopImmediatePropagation();
  var srcEl = e.target.closest("[data-myapp-src]");
  var src = srcEl ? srcEl.getAttribute("data-myapp-src") : "";
  var q = "?name=" + encodeURIComponent(ci.name) + "&idx=" + ci.idx + "&src=" + encodeURIComponent(src);
  fetch("/dev/__flow/" + encodeURIComponent(traceId) + q, { headers: { Accept: "application/json" } })
    .then(function (resp) { if (!resp.ok) { console.error("[construction-view] flow fetch failed:", resp.status); return null; } return resp.json(); })
    .then(function (f) { highlight(ci.name, ci.idx); showFlow(f, e.clientX + 8, e.clientY + 8); })
    .catch(function (err) { console.error("[construction-view]", err); });
}
document.addEventListener("click", onAltClick, true);
showFlow renders the result as a small card next to the click – the instance (#3/8), the ancestor path, the clicked value, the reads flagged as its source, and the d/history pivot line:
↳ recipe-card #3/8
wrap-locale › … › recipes-index › app-layout › base-layout › recipe-card
produced by
  ⛁ (d/q '[:find [?e ...] :where [?e :recipe/id]] db)   → [n=8]            @t1031
  ⛁ (d/pull db pattern eid)                             → {#…442 n=11}    @t1031
entity #17592186045442 — to see why it holds this value, check its write history (d/history)
When flow returned :ambiguous, the card says so – “N instances, couldn’t resolve which one (render reordering)” – rather than highlighting the wrong card.
Region-scoped traces for morphed updates
The page is not always one request. After an idiomorph <main> swap (or a dev hot-reload, which uses the same morphReload path), that region was built by a different request with its own trace. This is why record-page stamps X-Myapp-Trace on every HTML response: the dispatcher reads it, tags the morphed region with data-myapp-trace-id, and emits it on the dispatcher:morphed event. The overlay keeps a traces map keyed by id and switches the active trace when a region morphs in:
function ensureTrace(id, cb) {                       // fetch a trace into the cache once
  if (!id) { if (cb) cb(false); return; }
  if (traces[id]) { if (cb) cb(true); return; }
  fetch("/dev/__trace/" + encodeURIComponent(id), { headers: { Accept: "application/json" } })
    .then(function (r) { return r.ok ? r.json() : null; })
    .then(function (j) { if (j && j.spans) { traces[id] = j; if (cb) cb(true); } else if (cb) cb(false); });
}
function regionTraceId(elm) {                          // nearest morphed-region trace for an element
  var n = elm && elm.closest ? elm.closest("[data-myapp-trace-id]") : null;
  return n ? n.getAttribute("data-myapp-trace-id") : traceId;
}
document.addEventListener("dispatcher:morphed", function (e) {
  var id = (e.detail && e.detail.traceId) || regionTraceId(document.querySelector((e.detail && e.detail.target) || "main"));
  if (!id) return;
  ensureTrace(id, function (ok) {
    if (!ok) return;
    if (open) setActiveTrace(id);                      // inspecting → show the just-rendered construction
    else { traceId = id; trace = traces[id]; }         // closed → cache so the next open is fresh
  });
});
So the overlay follows one active trace, and the plain click is the interaction that switches it per region: click a component inside a morphed <main> and the overlay fetches that region’s trace, activates it, and selects the frame there; click back in the chrome and <html>’s trace becomes active again. Hover and Alt+click stay on whatever trace is active: a page hover still boxes any element, but it reveals a tree row only when that element belongs to the active trace, and an Alt+click’s flow queries the active recording. The same machinery fixed dev-hot-reload staleness at no extra cost: after you edit a view and the page morphs, the overlay shows the new construction, not the pre-edit one.
Surfacing a prior error, and detaching the panel
Two last affordances. A request that 500’d had no overlay on its error page, so the next good page shows a banner that loads the errored trace and focuses the throw:
function showErrorBanner(le) {
  if (!le || !le.id || le.id === traceId) return;
  var b = el("div", ,,,);
  b.textContent = "⚠ last request 500'd: " + (le.uri || "") + "  (" + (le.ex || "error") + ") — view trace";
  b.addEventListener("click", function () { b.remove(); loadTrace(le.id); });
  document.body.appendChild(b);
}
function loadTrace(id) {
  ensureTrace(id, function (ok) {
    if (!ok) return;
    activate(id);
    for (var k in trace.spans) if (trace.spans[k].threw) { setSelected(k, false); break; }   // focus the throw
  });
}
(start also fires the /dev/__last-error fetch we elided earlier and calls showErrorBanner on the result.) And because a full-height right-docked panel competes with the app for space, the header is draggable to detach it, and a ⤢ button pops it into a separate same-origin window. Our handlers still query document (the opener), so hovering a node in the popout still highlights the element in the main window; window.opener keeps the correlation alive across the window boundary.
Keeping production clean
Trace every piece of the whole feature (across all three chapters) and confirm it vanishes:
- The compiler.
:stormis a dev alias. Production resolvesorg.clojure/clojure, sets no storm properties, and records nothing. With no recording there is no timeline to read. - The middleware.
wrap-traceis added to the stack only whenclojure.storm.instrumentEnableis set, and only viarequiring-resolveof a namespace underdev/. Plain:dev(never mind prod) neither adds it nor loads the namespace. - The endpoints. Every
/dev/__*route resolves its handler throughrequiring-resolve, which isnilwithout the dev namespace, so they 404 in production. - The trace id and the overlay. Two different gates. The trace id is reached via the storm property:
data-myapp-trace-idis stamped only by the middleware, which is only mounted under:storm. The overlay ships in the dev asset block (the samerequiring-resolvegate as the inspector, so it’s prod-absent), and at runtime it is simply inert without a storm-stamped trace id. In production the script is absent; under plain:devit may load but finds no trace id and does nothing.
The feature is structurally absent, not merely disabled: the same bar as the inspector, reached through the storm property and requiring-resolve rather than the inspector’s dev? resource check.
Trade-offs & limitations, in one place
- Per-instance resolution counts only element-producing frames. The k-th match is taken over frames that actually emit an element, so
nil/conditional components no longer skew the index. The one case still unhandled is genuine render reordering (asort/reversebetween data order and DOM order), where the k-th frame and the k-th DOM node legitimately disagree; when an index can’t be resolved, flow mode says “couldn’t resolve which one” rather than guessing. - basis-t is “nearest in-scope db,” not a proof. When several db values are live it is the one the function was handed: correct in this codebase, an approximation in principle.
- Eid-matching is identity, not lineage. It tells you which query returned the entity, not which transform shaped the displayed string. Following a value through
str/subs/i18n/markdown to the exact datom is true taint tracking, the research-hard frontier (the Whyline asked this question of UIs two decades ago and it is still not a shipping feature). We stop one honest step short of it, and say so with thed/historypivot. - The DB-namespace allowlist is hand-maintained.
db-nssscopes the expression scan; a new DB-touching namespace must be added or its reads won’t surface. - The recorder is bounded to the current page-visit, not the JVM’s lifetime. FlowStorm’s timeline only grows while recording, so recording is on only for the span of a render and a full navigation clears the previous visit (see chapter 17). The recorder therefore holds the page on screen plus its morphs, not a days-long history – an earlier “record from boot” build leaked to ~30 GB, which is what this model fixed.
clear-recordings!//dev/__trace-clearremain as a manual escape hatch, and-Xmx2gturns any regression into a loud OOM. - No timing. Per-frame wall-clock would mostly measure the recorder; for profiling, use a sampling profiler.
- A real dev startup/first-hit cost. The compiler swap slows startup and the first hit to each page – paid only under
:storm, never in plain:devor prod.
The dual it rests on
The inspector rested on one trick: Hiccup is plain data, so you manufacture its source location and weld it to the value. This rests on the dual: execution is also data once a recording compiler is in the loop – so you read the trace, key it on the same coordinate the inspector already stamped, and the page tells you not just where each element is from, but everything the server did to put it there.